Technical assessment
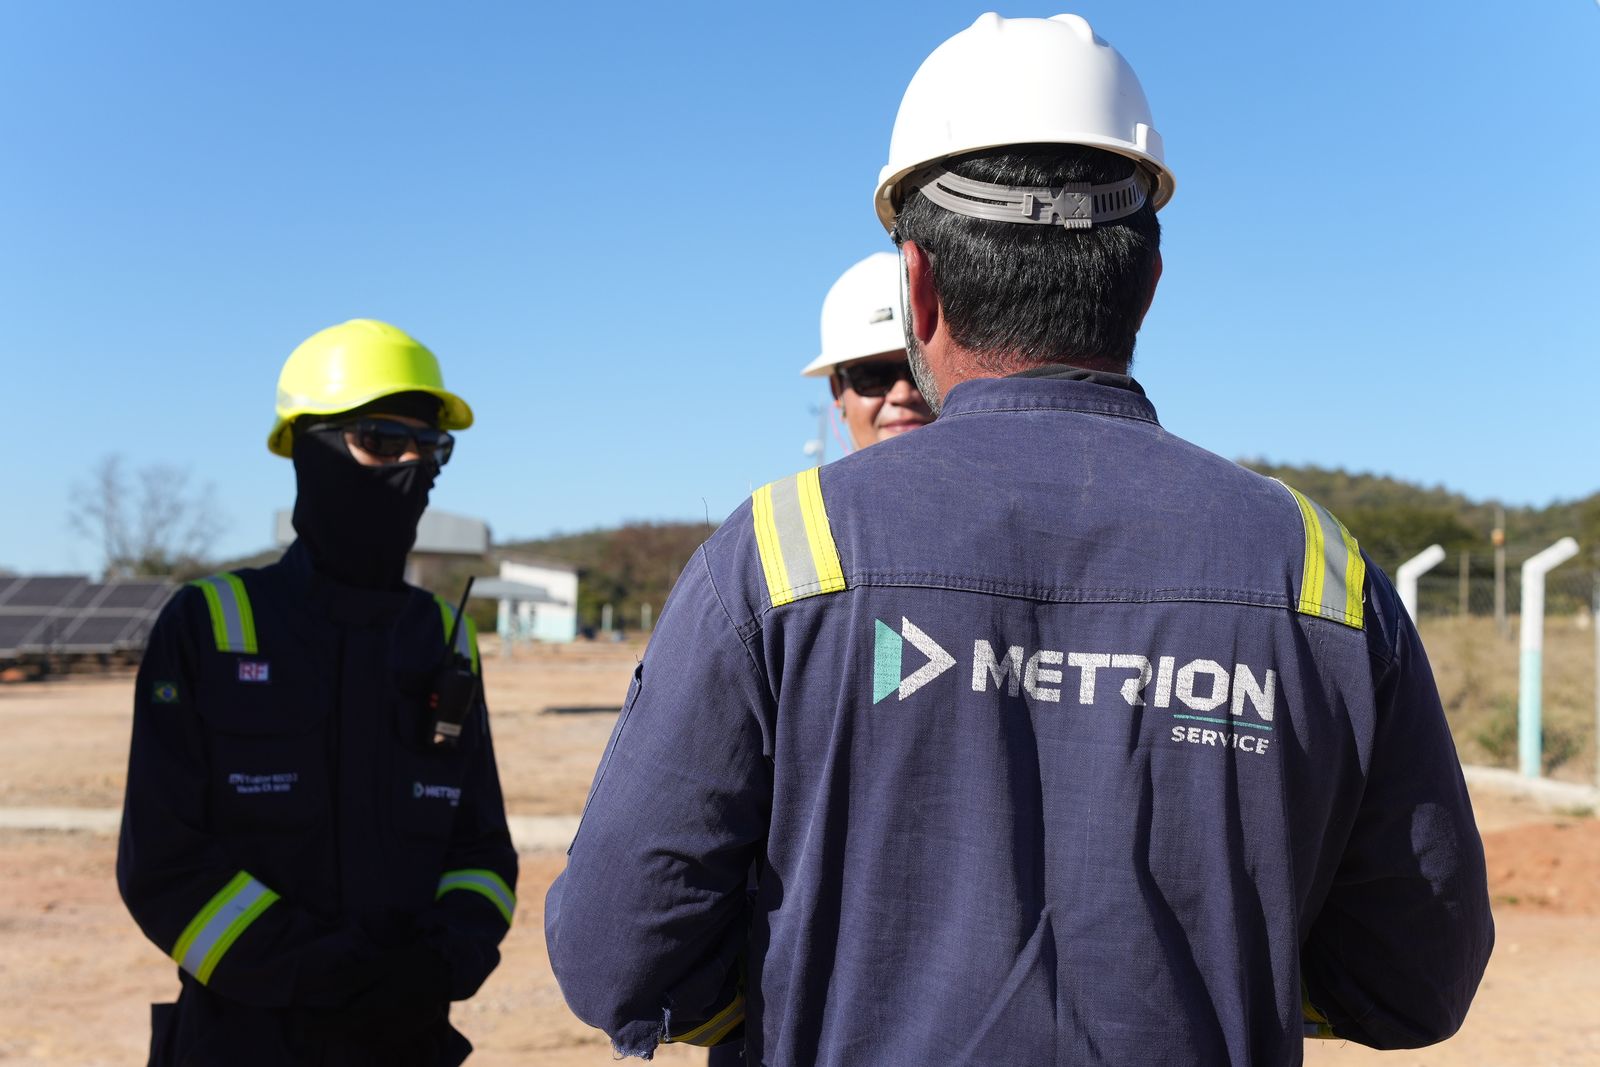
Metrion team in the field, PV plant in operation
Solution 01

Someone has to answer for the asset's result.

Not just for its repair. Metrion takes over the administrative management of your portfolio's operation and maintenance, with method, indicators and a decision routine, to meet or beat the business plan.

No commitment
Metrion team in the field, PV plant in operation

The method in one picture

Four fronts, one cycle that never stops.

360º Management is not a bundle of loose tasks. It is a closed loop: what performance measures becomes method, method becomes routine, and routine answers for results, which feed back into the next cycle's measurement.

MANAGEMENT 360º 01 02 03 04
  1. 01

    Performance

    Generation measured against target, broken down variable by variable through the Cascade.

  2. 02

    Method

    Asset management structured on ISO 55001 requirements, with maintenance planning and scheduling that actually plans and controls.

  3. 03

    Routine

    A fixed cadence from the operations center: the data arrives at the same hour, for the same decision.

  4. 04

    Results

    Every deviation becomes a mitigation plan with an owner and a deadline, all the way to the P&L and the ROI.

The solution

What it is

Administering the asset, not executing tasks.

We take over the running of the portfolio's operation and maintenance with asset management structured on ISO 55001 requirements. That brings method, indicators, a meeting cadence and an action plan with named owners. When the client opens the books, the tracking reaches the asset's P&L and ROI.

  • Performance management
  • Structured maintenance planning and scheduling
  • Operations center routine
  • Mitigation plan
  • P&L and ROI management
What it is for

So the asset meets or beats the business plan.

It turns generation into a number you can explain. Every gap between target and actual is broken down variable by variable through the Cascade method, and every loss gets a cause, an owner and a deadline. External loss is measured and recorded too, because without a record there is nothing to claim.

  • Cascade across 3 levels
  • Daily operations review
  • Monthly results review
  • ABC criticality matrix
  • Maturity ladder

Who it is for

Power producers in distributed and utility-scale generation, with plants above 1 MW.

The portfolio grew, the structure did not

More plants, the same team and no routine that scales. That is where losses start happening with nobody watching.

The report does not answer to the committee

Governance asks for auditable numbers with a calculation method. A spreadsheet per plant does not hold up in a board meeting.

There is O&M, what is missing is management

Someone fixes things, but nobody answers for the result. 360º Management adds method and indicators to the team already on the asset.

How this solution helps your company

What changes in your bottom line.

01

Generation stops being a mystery

The Cascade breaks the target down to observed generation, variable by variable. You stop arguing about whether the plant did badly and start discussing which variable took the kWh.

02

External loss becomes a legal asset

Weather and the utility take their share too. Measured and recorded, those losses support a claim. Without a record, they turn into permanent cost.

03

The routine starts to scale

A fixed cadence: daily operations review, weekly scheduling and executive meeting, monthly results review. The data arrives at the same hour, and so does the decision.

04

Decisions with something behind them

Every indicator carries a reference date and a calculation method. That is what separates a report from a decision making instrument in front of an investor.

05

Maintenance driven by criticality

The plan comes from asset function, failure mode and failure cost, through RCM, not from the supplier's calendar.

06

A read on returns

When the client opens the books, we work inside the asset's P&L. Operational results get read alongside returns, not separately from them.

How it gets done

From assessment to the first closed cycle.

IMPLEMENTATION TIMELINE typical timings for a mid sized portfolio
Week 0
Technical assessmentWe gather the data and give back a read on your current performance against the design.
Weeks 1 and 2
Survey and baselineAsset inventory, as built drawings, available history and the plant's own baseline.
Weeks 3 and 4
Taking over the routineABC criticality matrix built, 52 week plan scheduled, and the daily operations review starts landing every business day.
Month 2
First closed cycleMonthly results review with the Cascade across all three levels, and the first action plan with deviation, action, owner and status.
Quarter 1
Executive reviewResults against the business plan, position on the maturity ladder and, with open books, the read on P&L and ROI.
Ongoing
Monthly cycleThe cadence repeats and the maturity ladder measures progress cycle by cycle.

Indicative timings, adjusted to portfolio size and to the quality of the documentation received. Implementation does not interrupt operations: the new routine runs in parallel and takes over once the baseline is closed.

Want to know where your asset is losing generation?

We gather the data and give back the read, with the biggest losses named.
I want the technical assessmentTalk on WhatsApp
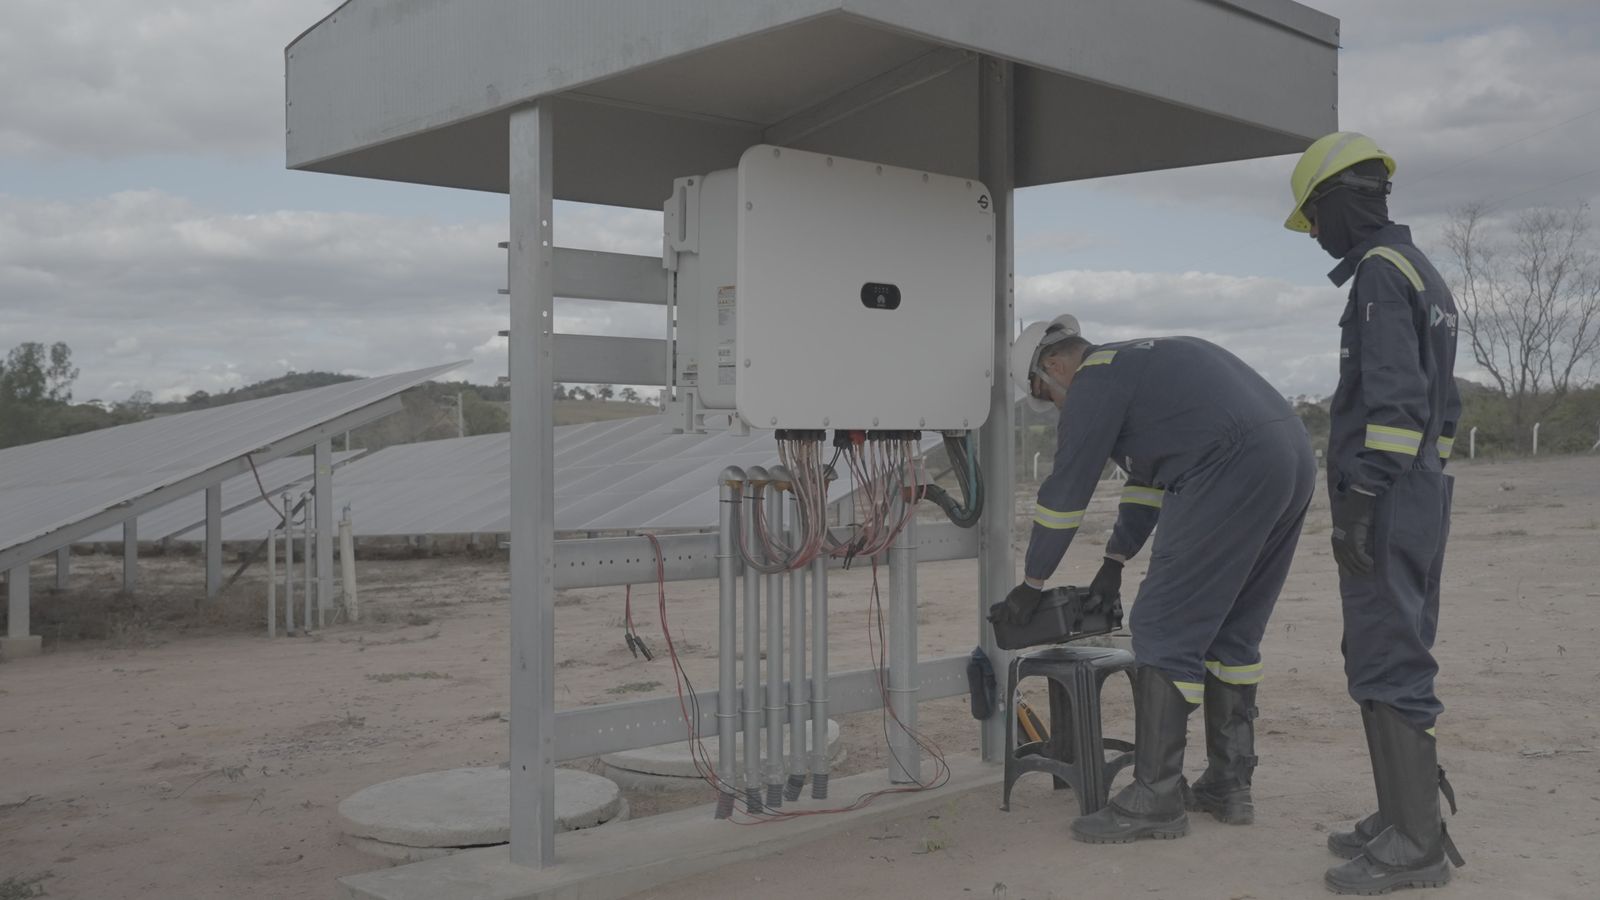
Metrion technicians running an inverter test
Solution 02

A plan is only worth something if someone executes it, records it and proves it.

On site or remote operation from our Remote Operations Center, running 12/7 or 24/7, with daily incident tracking. Maintenance as a single service, from preventive to corrective, plus upkeep and cleaning of the whole asset.

No commitment
Metrion technicians running an inverter test

The solution

What it is

The people watching and the people intervening, in the same operation.

Operations follow the asset while it generates, with our own telemetry and supervisory stack, and Engineering and Data Analysis in the lead. Maintenance executes the plan that comes out of RCM. The two fronts run together: what operations see becomes a work order in the same cycle.

  • Operations center 12/7 or 24/7
  • On site or remote operation
  • Preventive
  • Predictive
  • Corrective
  • Upkeep and cleaning
What it is for

So the plan leaves the page and leaves a trail.

It guarantees execution with evidence. An incident detected is an incident recorded, classified and routed the same day, and nothing is closed without a record. That history is what supports a warranty claim and proves a failure is recurring.

  • Daily operations report
  • Work orders backed by evidence
  • Asset history
  • 52 week plan
  • One off SPOT work

Who it is for

Plants that already have a plan but do not have reliable execution.

The failure comes back and nobody knows why

Corrective work with no cause analysis is not maintenance, it is a recurring failure you pay for in cash. A repeat offender inverter costs generation every cycle.

Cover outside business hours

An event at night or on the weekend turns straight into lost revenue. A 12/7 or 24/7 operations center closes that window.

The asset has no history

The team changed, the as built came in incomplete and the knowledge walked out. With no record there is no warranty claim.

How this solution helps your company

What changes in your operation.

01

Availability that holds

An average of 97.8% operational availability across the portfolio under management, as of July 2026.

02

A response with an owner

The incident is classified by criticality and routed the same day. The operations center decides whether it is an intervention now or a scheduled one.

03

Maintenance that prioritizes

The ABC criticality matrix decides what comes first. Asset function, failure mode and failure cost, not the calendar.

04

Recurring failures treated at the cause

When the cost justifies it, root cause analysis follows. An inverter that takes 16 MWh per cycle costs around R$ 96k per year if the cause is left untreated.

05

The whole asset maintained

Vegetation management, module cleaning, building and access road maintenance, perimeter fencing integrity. Not just the parts that generate.

06

Flexible contracting

You can hire the full package or one off SPOT services, without tying up the entire portfolio at once.

How it gets done

From mobilization to the first recorded cycle.

IMPLEMENTATION TIMELINE typical timings for a mid sized plant
Week 0
Assessment and scopeA survey of current condition, of whatever plan exists and of whatever history exists.
Weeks 1 and 2
MobilizationTeam assigned, PPE and tooling checked, procedures and work permits defined.
Weeks 2 and 3
Inventory and criticalityField asset survey and an ABC criticality matrix built from the failure modes.
Week 4
52 week planAnnual preventive schedule, with the first week already booked and the backlog prioritized.
From month 2
Execution with evidenceWork order, procedure and photographic record. Nothing is closed without evidence.
Ongoing
Recording and reviewCause, response time and associated loss go into the history. The backlog is reviewed every week, not piled up.

Remote operation from the operations center can start before field mobilization, as soon as communication with the plant is established. Upkeep and cleaning is part of the same contract, with no separate scope.

Already have a team, but the failure keeps coming back?

The assessment shows where execution is leaving an incomplete trail and what that costs per year.

I want my O&M assessedTalk on WhatsApp
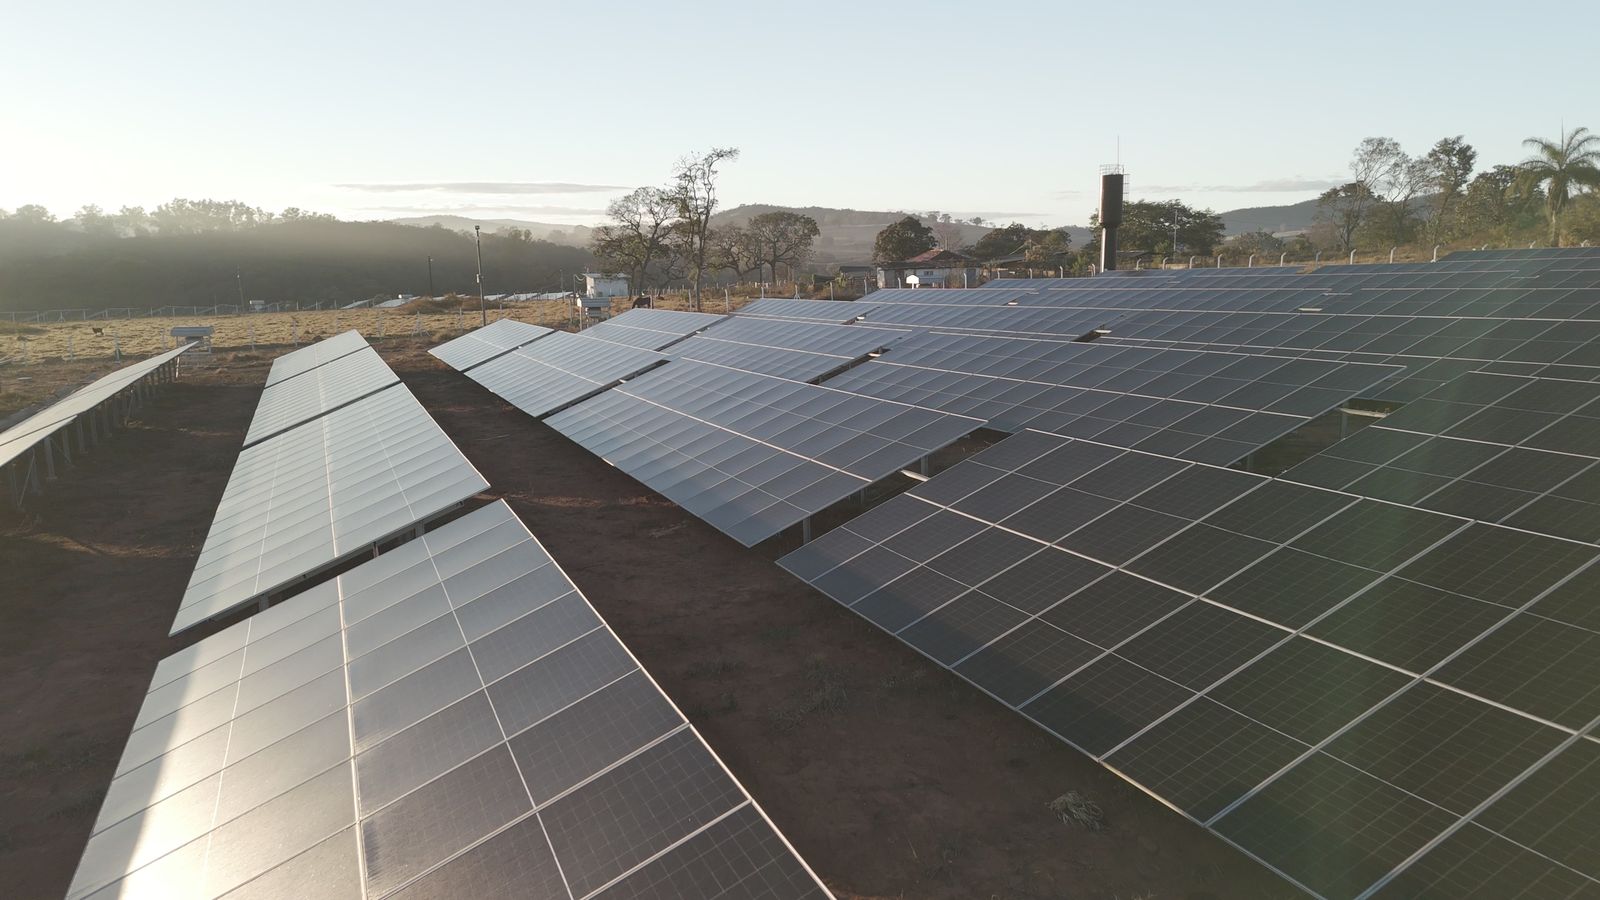
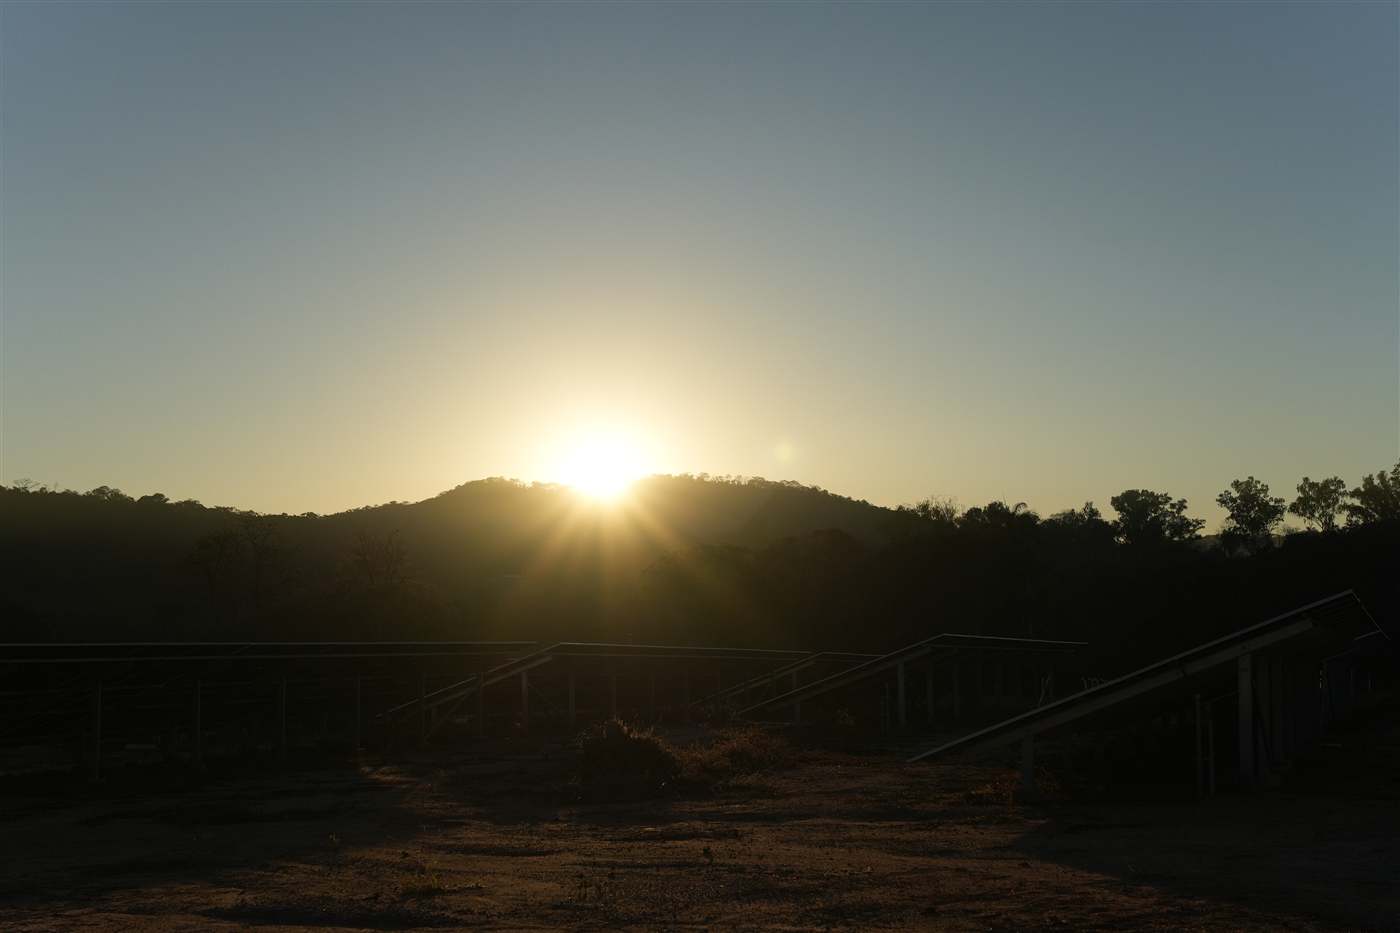
PV plant in operation at dawn
Solution 03

Technical presence before the asset exists.

And whenever it needs to change. Design from concept to detail, commissioning, construction management and owner's engineering. Technical due diligence for those buying, selling or simply needing to know what they hold. Retrofit to move the asset up a level.

No commitment
PV plant in operation at dawn

The solution

What it is

Engineering done by the people who will operate it afterwards.

Six fronts covering the asset life cycle: design, commissioning, construction management, owner's engineering, technical due diligence and retrofit. The criterion is always the same, and it is what separates our engineering from an installer's: the asset has to run for 25 years.

  • Design
  • Commissioning
  • Construction management
  • Owner's engineering
  • Technical due diligence
  • Retrofit
What it is for

So today's decision does not become a cost for two decades.

It keeps the choice that saves money during construction from showing up as lost generation in year five. And it makes sure the asset knowledge reaches operations in usable form, with complete as built drawings, test records and history, instead of walking out with the construction crew.

  • Maintainability built in
  • Complete as built
  • Deferred technical liabilities identified
  • Gains modeled and verified

Who it is for

People building, people buying, and people who need to move the asset up a level.

Building, or about to build

Design and construction overseen by whoever will answer for generation afterwards. The owner's side of the technical table, not the supplier's.

Buying or selling an asset

Technical due diligence covering condition, deferred liabilities and performance risk, read as impact on returns.

An asset running below its potential

A retrofit sized with the gain modeled before the decision and verified after handover.

How this solution helps your company

What changes in your asset.

01

The as built arrives complete

Documentation, test records and history reach operations in usable form. The knowledge stays in house.

02

Maintainability goes into the design

Access, layout and the cost of operating for 25 years factored into the design, not just today's CAPEX.

03

Performance secured from day one

Commissioning verifies before the asset starts generating, and avoids inheriting unfinished construction work.

04

You know what you are buying

Due diligence separates normal wear from deferred technical liability, with a read on the impact to returns.

05

Technical representation for the owner

Critical review of design, claims and scope changes against the EPC contractor and suppliers.

06

Retrofit gains verified

The gain is modeled before the decision and measured after handover, against the plant's own baseline.

How it gets done

From scope to handover to operations.

IMPLEMENTATION TIMELINE the sequence applies to a new project; for due diligence and retrofit the cycle is shorter
Stage 1
Scope and assumptionsDefining what will be delivered, with the operating assumptions already on the table.
Stage 2
Design or due diligenceConcept, basic and detailed design. Or a condition and liability survey, when the asset already exists.
Stage 3
Supervised executionConstruction management and owner's engineering, with schedule, scope and quality verified in the field.
Stage 4
CommissioningTesting, recording and performance verification before the asset goes live. This is the asset's turning point.
Stage 5
Handover to operationsComplete as built, documentation and history handed over in usable form to whoever will operate it.

For technical due diligence the typical cycle runs from stage 1 straight to stage 2, on a timeline set by the deal window. For a retrofit, stage 2 starts from an operating asset, with a baseline measured before the intervention.

The screen for whoever manages the build

CAPEX, schedule and progress on the same dashboard.

Managing construction without instruments means checking a spreadsheet after the money is gone. Metrion runs implementation with physical and financial S curves, a CAPEX ranking by discipline, a consolidated Gantt chart and a cash outflow map, all in one place and updated every cycle.

IMPLEMENTATION MANAGEMENT illustrative project · bioenergy plant (solar and biogas) · sample data
CAPEX plannedR$ 49,0mifinancial schedule
Cash disbursedR$ 27,6mi56.3% of CAPEX
Physical progress46,1%planned to date: 47.8%
Activities17of 382 behind, 4 critical

S curve

planned vs actual
Physical S curve · planned vs actual% of cumulative progress
Financial S curve · planned vs actual% of cumulative CAPEX
plannedactual

CAPEX by discipline

ranking
Earthworks and civil worksR$ 14.2M
Reactors and lagoonsR$ 10.6M
ModulesR$ 8.4M
Steel structuresR$ 5.9M
SubstationR$ 4.1M
PurificationR$ 3.2M
Compression and utilitiesR$ 1.7M
Power generationR$ 0.9M

Consolidated Gantt

bar = duration · fill = progress
Design, studies and permits
Earthworks and drainage
Civil works and buildings
Steel structures
Reactors and lagoons
Modules
Substation
Purification
Power generation

Progress by front

of the schedule completed
Earthworks and civil works
88%
Steel structures
62%
Reactors and lagoons
40%
Modules
19%
Substation
12%
Purification
4%
Compression and utilities
0%
Power generation
0%

Cash outflow intensity

darker color = month with the largest outflow

Illustrative dashboard demonstrating Metrion's project management method. Under contract, the reporting comes out on the agreed cycle and follows the investor's disbursement plan.

Building, buying or upgrading an asset?

The assessment maps what exists today and points to where engineering changes the operating result.

I want my project assessedTalk on WhatsApp

Start with the assessment

Technical assessment of your portfolio.

We identify which operational maturity scenario your portfolio is in, and which bottlenecks are holding performance back.

Most companies deliver services. We deliver performance.

Reply within 1 business day · your details are used for this contact only